
In my home lab we’ve come to rely on a number of services such that downtime on any one of them could cause a brief panic. Things like our MythTV server for watching over-the-air TV, PiHole server for DNS, or our Home Assistant automation system. Just like in a business production system there are a myriad of things that could go wrong with even simple home VMs. Stuff like filling up HD space, services not running that should be, or maybe an OS update hosed something. I’ve lost count of the number of times I decided to “apply patches quick” only to find out some library was now missing that used to be there and now service XYZ just won’t start anymore. This is annoying for me but basically kills any good will I have with my family just trying to just browse the internet on their tablets.
Suffice it to say I wanted a dashboard and notification system to give me some assurance things are working properly. In my professional life I’ve used a number of monitoring systems over the years. There are great open source and commercial products available that will monitor services and alert you when things are going wrong. Because I apparently do everything the hard way I decided to build one instead. In my defense my initial thoughts were that I didn’t need all the overhead of a true monitoring solution. All I really wanted was some up/down status information. I should be able to Python my way there pretty quickly and just be done with it right? Behold, the Trash Panda monitoring system.
Dislaimer - at the outset I’m going to say I don’t think anything in this project is groundbreaking or couldn’t be done with existing software. It was more of a “can I do it” kind of project. In this write-up it’s more about trying to document the process than the actual result. This is basically the workflow I use for any new project.
Table of Contents
The Idea
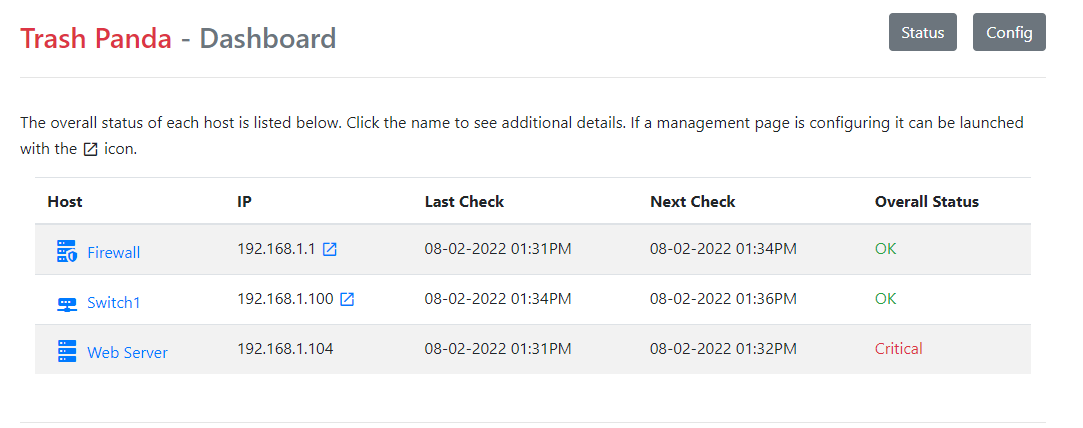
I decided to take the knowledge from systems I’d used in the past to design a very simple monitoring solution that could keep track of my home lab with pretty low requirements and overhead. In terms of how this functioned I envisioned a series of “host” containers that represented a piece of hardware or virtual machine. Each host could contain one or more services important to keep running. Using some sort of a timer each service would be checked and it’s state stored (good/warning/critical). A web dashboard would show each host as well as it’s overall status. This is pretty typical to many well-known systems, like Nagios. I wanted to leverage existing service check scripts written for programs like Nagios so keeping somewhat with convention here was important.
My overall design had a few hard requirements:
- No database dependencies - I didn’t want to mess around with maintaining a DB schema or running another database server (even a file based one like SQLite)
- Web based - this is almost a no brainer these days but it needed a web based dashboard and a REST API for quick access to the data
- Flexiblity - I didn’t want to hardcode a lot of specific stuff for my system. I needed the flexibility to add service checks without constantly re-writing chunks of code. Basically a flexible configuration layer separate of the codebase (aka config file).
- Scale - in my case I wanted the inverse of this - not to scale. My goal is to monitor a selection of home lab systems - not a full company’s production environment. As such I didn’t want to spend a lot of time worrying about interacting services, scaling to hundreds of service checks, etc.
I added a few other bells and whistles as the project went on but basically these requirements drove the majority of the design decisions.
Architecture
I’m a creature of habit so for the overall architecture I fell back on a few tried and true methods I’d used before for this project. Python was an easy choice just to get this moving quickly. Along with that I could leverage tools like Flask and Jinja that I’ve used before to quickly get a web service and templating system going. Using YAML for the layout of the configuration files also made sense. Requirement #1 above did hamper me in a way. I was sure I didn’t want the burden of a database but there was also a need to store information, even if temporarily, so that the overall state of the monitored services could be tracked. A flat file could work for this but part of me hates the inelegance of reading/writing to flat files for that kind of thing. I decided to bend my rule a bit and go with Redis for this. It’s pretty lightweight and I could easily store some data, JSON formatted, as the program ran.
I think it is worth noting that had my above requirements been different a lot of these choices could have gone differently. Scalability would have made me look more at other language options or even multiple services like a PHP frontend and Java backend. If I had wanted a database that would have added a lot of complexity but opened the door to things like more web based configuration options; as the info could have been stored in a database instead of a flat config file. Basically the design requirements directed a lot of decisions. I don’t like to start with “I’m doing this in Python” and make the requirements fit, the tools need to fit the problem.
Workflow
With these decisions made I could begin to map out the core workflow of the system. I typically envision the running of a program in three stages.
- What information does it need at startup?
- What is the program loop doing?
- How to handle errors (aka how will it break)?
The startup information is important as that helps me define what kind of a class structure I might need and what minimum info is needed to launch the program. The program loop defines the normal operation of things. The exceptions handling is handling the odd use cases or sometimes just defining what situations are worth halting the whole thing.
In this case I determined I’d need a web service (using Flask) and a class to hold the logic for checking the host services. These would load at startup and use a config file to read in the host information. Data from the monitor process would be stored in Redis so that the web front end could grab it for display.
Building
The first thing I wanted to do was get some type of minimal system up and running to play with. I found a library called pythonping that could send ICMP requests via Python. A few lines of code later and I had a system that could ping a series of IP addresses, read from a config file, and display the up/down status on a web dashboard. Success!
from pythonping import ping

class PingCheck:
    count = 5  # number of ping requests to make

    def __init__(self, count=5):
        self.count = count

    def check_host(self, ip):
        responses = ping(ip, verbose=False, count=self.count)

        # get total of "success" responses
        total = list(filter(lambda x: x.success == True, responses))

        # if over 50% responded return True
        return True if (len(total)/len(responses) > .5) else False
I also wrote a function using the subprocess package to load generic command-line scripts and capture the exit results. This is pretty basic Python code but allowed me to leverage already written check scripts for various services (or define my own later). This opened the door to using the Nagios plugins package. An example of this in action is:
import subprocess
import os.path

def _run_process(self, script, args):
    command = ["python3", script] + args
    print(command)
    # run process, pipe all output
    output = subprocess.run(command, encoding="utf-8", stdout=subprocess.PIPE, stderr=subprocess.PIPE)

    return output

# run a check to a python script: check_command.py -H host_address
output = self._run_process(os.path.join("check_scripts", "check_command.py"), ["-H", host_address])

# print the result 0=success, 1=warning, 2=critical
print(output.returncode)
print(output.stdout)
Bad Design Decision
Once the ping checks were working I started to think about the service checks. My first attempt at this lead me down a bad path. I originally thought that I’d have a handful of concrete host types. Stuff like a Switch, ESXi host, or a web host. I thought I could hardcode specific Python classes that would hold the service checks needed for these types. This is a clear violation of my design requirement #3 but my reasoning was I had such a small number of hosts I wouldn’t have a lot of sub classes to deal with. This would lead to a simplified config file. I could simply give each host a type value that would load the appropriate Python class.
This all worked great (or so I thought) and I continued on to other things.
Metadata
As I was building the layout of the configuration file I realized I could use the web interface to display other information about each system. This way the dashboard could serve as both a monitoring system and jump point into management pages for each service. For a better visual I also tied into Material Design Icons so hosts could associate an icon with their purpose - like using the Home Assistant icon for my Home Assistant server. I built these into the system as well so my config file started to look like the following:
[
  {
    "type": "switch",
    "name": "Switch 1",
    "ip": "192.168.0.1",
    "icon": "switch",
    "config": {}
  },
  {
    "type": "esxi",
    "name": "ESXi 1",
    "ip": "192.168.0.2",
    "management_page": "https://192.168.0.2/ui/",
    "config": {
      "username": "root",
      "password": "pass"
    }
  }
]
Bad Design Decision Part II
As I started to add more and more systems to the monitoring system I noticed my Bad Design Decision from above was starting to become a problem. I had many hosts that didn’t fit pre-defined types. What if a host had a web service but on a different port? What if it had multiple web services? What about a database and a webservice? I tried to code around this by defining concrete service classes that could be assigned to a host via the config but the writing was already on the wall. This wasn’t going to work. I was going to have to be more flexible in my definitions.
I began the hard process of separating out services from hosts…..
Simple, Flexible, Design
The final program design is probably less simple than I intended but way less complex than other monitoring systems. To maintain flexibility I decided to separate out the idea of service definitions from individual hosts. This allowed a single host definition to add whatever services it needed. I did include an element of inheritance to cover commonly used service types. First a service is defined. Note that this is little more than a path to the actual check command along with any arguments needed to run the check.
services:
  switch_uptime:
    command: "python3 {{ path(SCRIPTS_PATH, 'check_snmp.py') }}"
    args:
      - "-H"
      - "{{ host.address }}"
      - "-c"
      - "{{ default(host.community, public) }}"
      - "-o"
      - "1.3.6.1.2.1.1.3.0"
Jinja templates are evaluated at runtime. The default() function allows you to specify a default argument or supply one from a host definition later. Once the service is defined you need to define a host type. These can be very basic or include default service checks.
types:
  generic_server:
    name: Server
    icon: server
  generic_switch:
    name: Switch
    icon: router-network
    info: "This device type will work with generic managed switches. SNMP information must be correct and setup on the switch for services to properly be queried."
    config:
      community:
        required: False
        default: "public"
    services:
      # this references the check defined above
      - type: switch_uptime
        name: "Switch Uptime"
Finally individual hosts can be defined. These will inherit any service checks from the type definition, or they can add their own.
hosts:
- type: generic_server
name: "Server1"
ip: 192.168.1.5
- type: generic_switch
name: "Switch1"
ip: 192.168.1.100
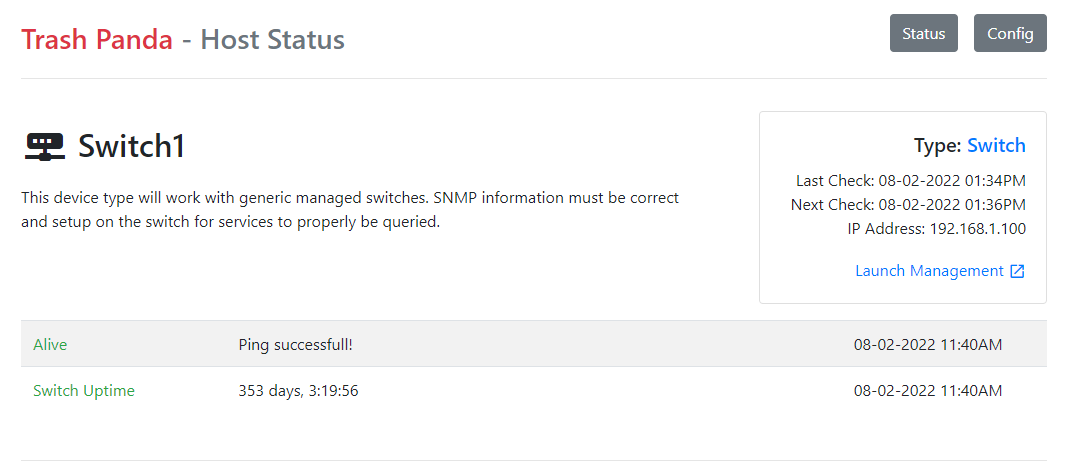
management_page: 'http://192.168.1.100/'
Here is a picture of the switch loaded and displayed in the web frontend.
Config File Verification
Just looking at the simple examples above you can quickly see how the basic config file from earlier suddenly became huge. All service definitions are now in the config file rather than stored in the program logic. While adding flexibility this made the config very easy to mess up. To combat this I added a YAML syntax verification check with Cerebrus. Cerebrus is a great tool that allows you to define the schema to be used and compare your file to the schema. This is similar to XSD validation for XML files. This check is done at startup and also can be initiated from the web interface to make sure the config makes sense. This doesn’t mean everything will work great, but is a nice sanity check to make sure the program will even run.
Conclusion
This was a really fun project to build, even if the complexity of it did get a way from me. By leaning on the templating functionality of Jinja for the configuration files I was really amazed at how flexible of a system I could create. I think this is also a really good example of how well thought out requirements in the front end of a project will drive some design decisions as things play out. My Bad Design Decision was totally avoidable based on my requirements, I just thought I could shortcut it and ended up having to rethink things later.
I’ve been running this system on my home network for a few months now. It has helped me find a few issues prior to them becoming major problems so it’s doing it’s job. Looking back it may have just been easier to utilize an out of the box solution but sometimes the journey is more fun than the destination.
Quick note on the name Trash Panda. This was basically my way of re-iterating that this is not a polished, high-end project. Much like a trash panda (aka raccoon) this project is a bit messy, probably unwanted, and not as good as the real thing.
Links
- Trash Panda Monitoring Solution - Project on GitHub
- Flask - Micro web framework for Python, used to build web interface
- Jinja - Python templating engine, used in the web interface as well as config file
- Nagios Plugins - collection of pre-made service check scripts
- Cerebrus - used for YAML validation